Investment Overview – Frontier Communications

Geoff Di Felice & Marcus Guzzardi

This is an extract from the Endeavour Fund’s half year 2024 investor letter.

Frontier Communications is our largest Reversionary investment. The US-based company traces its history back close to ninety years and by the 1990s was focused on telecommunications. By then broadband had been an attractive growth market for many years and hubris started to creep in. Management of the day believed their earnings to be highly resilient and built a financial model consistent with this – high debt and high dividends.

However, most of Frontier’s asset base remained in legacy copper-based technology which did not compete well against cable in the growing high-speed broadband market. Further, given their over-leveraged balance sheet Frontier could not invest in their network to upgrade their technology. This led to a debt spiral, as Frontier begun to lose customers their debt burden grew, ultimately leading to bankruptcy in 2020.

With the bankruptcy process the humility cycle commenced. Frontier restructured their balance sheet, recruited a new management team, and developed a strategy to upgrade their network and revamp their customer service. The company re-listed in 2021 under the ticker FYBR (“Fibre”).

Underappreciated Talent

When we assess the management team of a low risk turnaround, we look to invest alongside management teams who are both industry and turnaround specialists but importantly exhibit behavioural characteristics that include¹:

  • master communicators
  • teachers who create leaders
  • create execution focused mindsets.

Frontier attracted exceptional industry and turnaround specialists in Executive Chairman John Stratton (25-year career as a President of Verizon) and CEO Nick Jeffrey (30 years, including turning around Vodafone UK). And around them built a first-class team of executives and board members.

Then through the relationship we’ve built with the company we have been able to observe their behaviours, this included in one of our early meetings with Frontier they described to us a Friday afternoon ritual instituted by Nick. He would take the entire executive team to spend the last two hours of each week with the customer service team reviewing all the pain points from the week. This anecdote deeply resonated with us – it was a powerful communication tool, it was a teaching moment and it instilled a cadence of performance measurement.

How was Frontier, a recently bankrupt small cap telco which hadn’t grown earnings for close to a decade, able to attract a management team of this calibre? The value creation opportunity of deploying fibre at Frontier is highly unique amongst low growth telcos and the remuneration structure carves out six percent of equity for management, giving them the ability to share in this value.

Inevitable Industry Trends

Fibre networks provide broadband connectivity, which is both highly resilient and growing (+20% growth in traffic per annum). Over the long term, Cable has taken all the broadband industry’s incremental subscribers in what has evolved to be a de facto monopoly.

Today the broadband market is reasonably mature. Broadband penetration is c. 85% of households with cable holding c.65% market share. Industry revenues should reliably grow in the mid-single digit range driven by a combination of pricing growth and modest contributions from penetration and household formation.

However, under the surface there are several moving parts. Fibre is increasingly asserting itself as the superior and necessary broadband technology to serve the ever-growing data consumption by offering faster speeds, symmetrical performance (download/upload) and greater reliability than cable (it’s also cheaper to operate and maintain). Fixed Wireless Broadband (FWB) continues to expand aggressively and now accounts for c.5% market share2.

Given this backdrop, Frontier’s strategy is straightforward – to upgrade their existing copper network to fibre and then reach a terminal penetration of 45% (50% market share, 90% market broadband adoption) by selling a superior product at the market price.

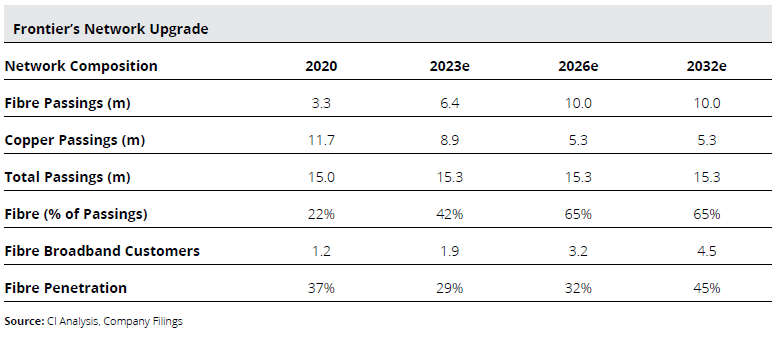
Frontier started the build in 2021 with a network passing c.15m locations, of which c.12m were served by copper and c.3m by fibre. By the end of 2026 we expect Frontier will have replaced c.7m of these copper locations with fibre. The network will then consist of 10m fibre passings and 5m legacy copper passings. As of today, the build is about two and half years in, with over 40% of the network in fibre. It should then take four to five years to fill the network with customers and reach the expected terminal penetration of 45%.
Financial Quality

In assessing financial quality our objective is to understand the earnings, returns and balance sheet quality of a business. We do this through observing both the financial track record as well as the incremental or unit economics which provides insights into changes and trends in financial quality. We assess the balance sheet as a source of both latency and risk.

Frontier’s longer term track record is certainly underwhelming – earnings have been declining for many years. Further, current free cash flow is negative owing to the rollout of the fibre network. But the unit economics of Frontier’s fibre deployment are very attractive, especially for a project of this scale. Our analysis suggests that the project should generate an unlevered return in the mid-teens.

We think of Frontier’s financial profile as a roll-out which is where capital is deployed in a repeatable and modular fashion. Other examples include retail or restaurant store rollouts (e.g. Starbucks or Walmart) which over time have proven to be some of the highest returning investments in listed markets. Successful roll-out opportunities should have a stable demand profile, attractive unit economics and a meaningful scope to deploy capital at these economics. Frontier’s broadband roll-out fits the bill.
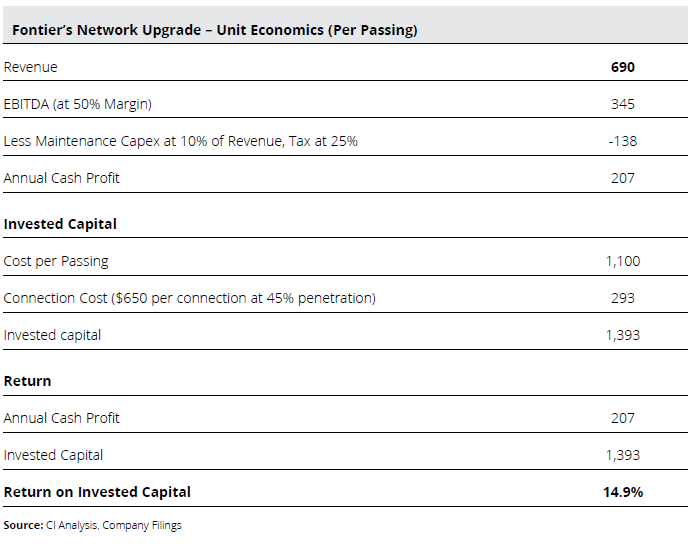
The majority (85%+) of revenues are earned by selling broadband to residential consumers, which is a function of Revenue per Customer and Penetration of customers on the network. As at the end of 2023 Frontier are a little under halfway through the build. Our de-risking observations around the important inputs to the project’s returns are as follows:

  • Revenue per Customer – pricing remains rational in a duopoly market structure (for high-speed products) with pricing growing at a mid-single-digits across the industry supported by a more inflationary environment.
  • Penetration – Frontier expect a terminal penetration of 45%. In Frontier’s legacy fibre footprint (which had historically been very poorly managed) penetration is currently 44% (and growing). For the newly built fibre, penetration rates are tracking in line with expectations – for example penetration of the fibre deployed in 2022 is in the high-teens within the first year.
  • Cost to Build – costs are running higher than originally expected. We now expect that the cost per passing will be c.15% higher for the remainder of the build. Labour is the primary cost which has been in tight supply. We note the clear offset here with Frontier able to recoup these additional build costs through moderate annual price increases.

A project of this scale requires capital. Understanding the requirements of sources of this funding has formed another important leg of our financial quality analysis. As of today, what was in 2021 a “to be determined” funding risk has evolved into a strategic advantage. Frontier has been able to access very attractive securitised funding by using its pre-existing fibre assets as collateral. Through the combination of internally generated cash flow and this funding, Frontier already have liquidity to build to c.9m fibre passings (or up to the end of 2025). We expect the funding required for the remaining 1m passings to be arranged well ahead of time but not so early as to impose unnecessary interest costs. This favourable funding position is another unique attribute of the Frontier build in a world where capital is much harder to come by.

As the build costs roll off and the network matures there will be a wall of free cash flow coming to shareholders. Over the next few years credit metrics (Net Debt/EBITDA) will weaken. But we believe this overstates leverage due to the ramp up effect – the debt is drawn and the fibre built but it takes four to five years to ramp and reach steady state EBITDA (and up to two years to break even). Therefore, there is embedded value not reflected in the EBITDA. We think a more useful way to think about the funding is that each passing is funded roughly 50:50 with internally generated cash flow and debt. This is appropriate for a project of this type.

Value Latency

Using a broad range of valuation metrics (strategic takeout, listed peer multiples, discounted cash flow valuation), it is almost inescapable to conclude that the fully built fibre network will be worth tens of billions of dollars – multiples of Frontier’s current value.

To demonstrate this simply if we take the unit economics outlined above and scale it up for the entire fibre network of ten million passings then the total annual free cash flow to shareholders will be c$1.2bn. Frontier will generate a highly resilient stream of subscription revenues at high margin which we believe will warrant at least a market multiple of 17.5x. Then the stock is worth nearly 4x its current value.
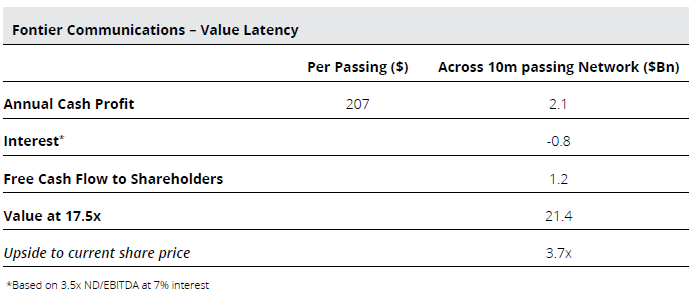
Beyond this simple illustration of value there are material latencies including historical operating losses which will shield cash taxes until the end of the decade, capital return via buybacks improving per share free cash flow, better profitability, higher penetration and additional copper upgrades through acquisitions or access to government infrastructure funding as well as the opportunity to better serve business customers.

A fibre network passing 10m locations across the US also has significant strategic value for other large telcos looking for fixed infrastructure to complement their wireless networks in offering a converged product. Additionally, we believe the cash profile of the completed network would also be very appealing to infrastructure or pension funds.


¹ We wrote about these in our post titled Lessons from Railroader in December 2022.

2 FWB uses wireless spectrum (as opposed to fixed networks) to provide broadband connectively to those who are ultimately likely to be value conscious moderate use customers. There are also unavoidable technical and economic limitations. Put simply it is c.20% the speed of a fibre connection and monetises the spectrum at upwards of 20x less than if used to offer mobile services.
We note the recent example provided by cable company Comcast who disclosed that NFL Thursday Night Football which is delivered on streaming platform Amazon Prime subsequently accounts for a quarter of cable network total capacity during gametime. FWB networks are incapable of serving this demand beyond a very small cohort of customers. Fibre can do it just fine.
Value Latency in Long-Life Royalties

Geoff Di Felice & Marcus Guzzardi

Real Assets provide ballast to the portfolio as low correlation investments which maintain their real value over the long term. At certain points they may be a potential source of capital for re-deployment into Compounding or Reversionary opportunities.

We strictly avoid highly financialised investments such as those with excessive leverage or high institutional ownership which can dilute the “real” attributes of the underlying asset e.g. many listed property or infrastructure assets. Instead, we have gravitated towards Royalties and in particular Mineral Royalties.

In last year’s letter we provided an overview of Royalties, which make up approximately 12% of the Fund. This year we will add to this by providing an overview of a key value latency we focus on – Long-Life Value Latency.

Royalty investing is a specialist asset class; this is due to the heterogenous nature of both the underlying assets and the structures. A royalty asset could be a 10-year royalty over an asset at the high end of the cost curve, or it could be a perpetual royalty over the most cost advantaged mines.

It is the latter that we focus on, as we believe very long-life assets have significant value latency that is fundamentally misvalued by capital markets. This is because standard valuation techniques fail to capture their magic, and most investors have time horizons measured in months and quarters, not decades.

Long-Life Value Latency

Let’s assume we have two cash flow streams, Asset 1 (20-Year Asset) and Asset 2 (100-Year Asset). Both will pay you $100 per annum; Asset 1 will pay this every year for 20 years, and Asset 2 for 100 years.

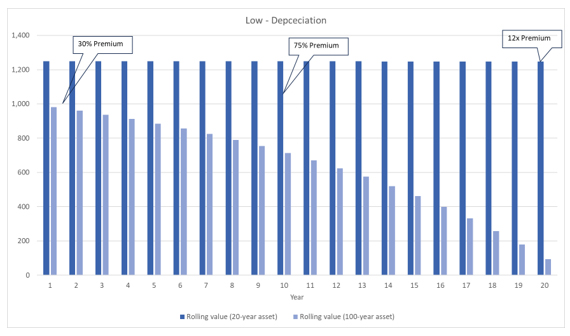
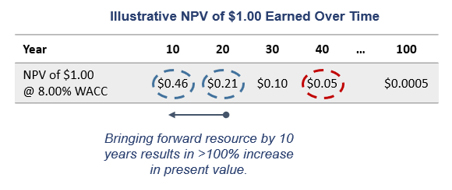
Assuming you discount these cash flows at 8% (to compensate you for risk and inflation) you would only pay a ~30% premium for Asset 2 despite it having an asset life five times longer! This is due to those far-out cash flows (years 21 to 100) receiving low value¹.
However, these long-life assets have two powerful sources of latency:

  1. Low Depreciation ; and
  2. The potential to be “brought forward”

Whilst the value premium the 100-year asset receives initially is just 30%, this increases every year as the 20-year asset approaches $0 value in year 20, at which point the 100-year asset has lost less than 1% of its value, with 80 years of cash flow remaining.

Low Depreciation

Source: Internal Cooper Investors Analysis

Just as the value of a cash flow occurring many decades in the future has little value today, there is extraordinary value in bringing those cash flows forward, as shown in the table below. This occurs when more capital is invested to expand a mine or new technology emerges that improves extraction rates.

Source: Internal Cooper Investors Analysis

Let’s bring this to life with some case studies.

Sabine Royalty Trust Case Study

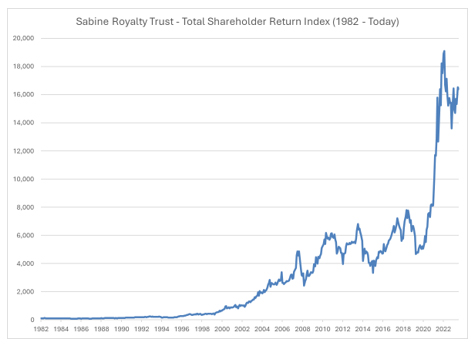
“In 1982, when the Trust was first formed, it was estimated that the reserves for the Trust were approximately 9 million barrels of oil and 62 billion cubic feet of gas. At that time, the Trust was expected to have a life span of 9 to 10 years and be fully depleted by 1993. In the 40 years since the inception, the Trust has produced approximately 23.1 million barrels of oil and 288 billion cubic feet of gas.

As a result of this production, the Trust has paid out approximately $1.466 billion to Unit holders over the years”
– Sabine Royalty Trust, Annual Report 2021

The Sabine Royalty Trust (SBR) illustrates a case of a very long-life asset which was underappreciated. At the time of founding, the Sabine Royalty Trust was assumed to have just 9-10 years of resources remaining. This was based on existing technologies and drilling methods. But as a perpetual claimant on this resource, all future technology developments accrued to them (at no cost as a top-line royalty owner). This has resulted in decades of royalty payments creating extraordinary value for investors.

Source: Factset

PrairieSky Royalty Ltd.

We are investors in PrairieSky Royalty Ltd. (PSK) a perpetual royalty owner over significant lands in Canada’s Western Canadian Sedimentary Basin (WSCB), providing our investors with the Long-Life Value Latency described above.

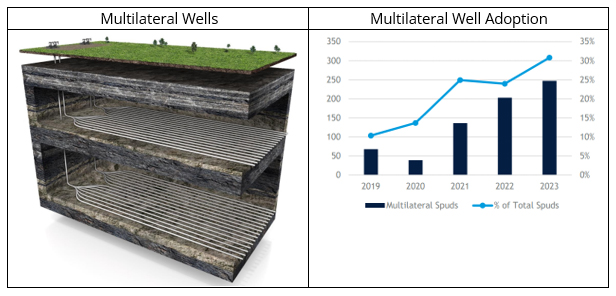
One of the key recent technology developments in the WSCB (a heavy oil basin) has been the adoption of multilateral wells. Multilateral wells are significantly more efficient as they create multiple laterals per wellhead. This reduces the number of wells required (reducing drilling costs) and improves recovery volumes (enhancing the economics of reserves). In some cases, this can lead to operators doubling their recovery rates. The adoption rate is increasing across PSK land (now around 30%) as operators learn and apply it more broadly. The improved economics drillers achieve will increase their investments and ultimately bring forward our economics.

Source: PrairieSky Royalty Ltd.

For Long Life related latencies to be realised the company must own resources with low disruption risk (i.e. will they be needed in 25 years time?), a high quality resource (to attract industry investment) and the focused management behaviour to realise and protect value.

To give a sense of latency, we estimate this company will earn circa 60% of its market value over the next decade in free cash flow. There is then a further four decades of reserves beyond this. As a top line royalty owner, this all comes without having to spend another cent.


¹ Using a Discounted Cash Flow technique cashflows are discounted using the following formula, Discount factor=(1/((1+8%)))n, where n = year. So, $100 in years 25/50/100 is worth just $14.60/$2.13/$0.05.

Insights – Lessons from Railroader

Geoff Di Felice & Marcus Guzzardi

“While scrutinizing Canadian National Railway’s network via one of his screens at home, he saw a problem. Something was amiss between Jackson, Mississippi, and Memphis…Harrison called the dispatcher in Homewood, Illinois, to investigate.

“I’ll do the dispatching tonight,” he told the employee. “Just stay on the phone and I’ll dictate the needs and priorities. Here’s what we want to do.” Ultimately, he pulled an all-nighter – as dispatcher – to solve the gridlock that was affecting the whole railroad. While he did, the employee was treated to a master class.”

The above passage describes Hunter Harrison as the 64-year-old CEO of Canadian National Railway, totally immersed in his business with the ability to dive directly into the frontline operations to drive forward its turnaround. Hunter is an archetypal Turnaround Specialist – a leader who has built a track record of success across multiple turnarounds.

Railroader by Howard Green is a book rich with insights into what made Hunter so successful providing many lessons for the Endeavour Fund in identifying the next generation of Turnaround Specialists.

Hunter had an “atomic level understanding” of the railroad business.

Hunter started at the bottom, as a carman oiler at the age 19. Whilst he had raw talent, it was unfocused but through railroading he found his calling – he truly lived and breathed it. Through hard work, a unique sense of the business and mentorship Hunter developed to become one of the best operational managers. As CEO this meant Hunter could visualise the theoretical potential of the business – and drive people toward it.

Hunter was a master communicator using many channels and methods.

A turnaround is about changing both the culture and processes of an organisation. This requires exceptional communication to break through, not once but on a sustained basis. Hunter was a master. He used one-on-one encounters (that would permeate through the organisation), he wrote operational manuals and he ran company-wide seminars known as “Hunter Camps”.

Hunter was uncompromising but he was a teacher who created leaders.

Leaders like Hunter are uncompromising. In an underperforming organisation many employees will feel uncomfortable with the expectations he sets and many will leave on unhappy terms. While others will feel unleashed, wanting to develop to their potentials and be part of a winning team. So when doing our due diligence it can be a fine line determining the difference between an emerging high performance culture and a toxic culture.

Hunter’s story highlights a key aspect of answering that question is observing how the leader builds the people around them. Hunter invested significantly in people (but only those that wanted to learn), seeing all these opportunities as teaching moments, with some of his key people emerging as industry leaders.

Hunter created an execution focused mindset.

Hunter set hugely ambitious targets. If the organisation was lagging the industry, he set their targets to the best. If they were the leaders, he set their targets beyond the frontier of what others thought possible. Crucially, he was outcome and results focused and he utilised data heavily to measure performance and identify ways to improve.

Endeavour Fund application

In a meeting with a Low Risk Turnaround opportunity in early 2022, the management team described a Friday afternoon ritual instituted by the CEO (a turnaround veteran). He would take the entire executive team to spend the last 2 hours of each week with the customer service team reviewing all the pain points from the week.
This anecdote deeply resonated with us – it was a powerful communication tool, it was a teaching moment and it instilled a cadence of performance measurement. We immediately elevated the opportunity on our priority list and today it is a key holding in the Endeavour Fund.

Case Study – Ryan Speciality

Geoff Di Felice & Marcus Guzzardi

“It was like he had trained all his life for that position. It was like he’d been genetically designed for that particular period of time.”

Warren Buffett
Describing John Byrne (Geico CEO 1975-1985)

On The Road Lunch with Pat Ryan

When we saw the twinkle in Pat Ryan’s eyes as we shook his hand it confirmed how integral our visitation program is to our investment approach. We were in Naples, Florida on our maiden trip as part of the Endeavour Fund, sitting down to lunch with insurance legend and Ryan Speciality Group (RSG) Founder Pat Ryan and his President Tim Turner at Pat’s Country Club.

The ambition of this trip was to nurture the relationships with the founders and executives of our key holdings as well as build some new relationships. We traversed the US meeting incredible entrepreneurs, many who generously spent several hours with us discussing their careers, businesses and the emergent opportunities and risks they are observing.

The Endeavour Fund is relationship-centric not transactional, this means we invest the time and energy to build partner-like relationships with a small group of exceptional leaders. It has taken us over a decade to build our reputation as thoughtful, long term investors and cultivate this global network.

Lunch with Pat and Tim in many ways represents the pinnacle of this effort. We are excited to share the insights from this experience with our investors. But there’s a trap in investing in falling in love with yesterday’s champion or viewing managements’ actions with rose tinted glasses (we have committed both these sins many times).

So we have developed a simple saying: we don’t write Corporate Biographies. By this we mean, we’re not looking to write about past victories, we want to participate in the future success. We look for leaders with a track record of success AND with their best years ahead of them.

To apply the blow torch to the concept, the above Warren Buffett quote is what we ultimately aspire to see in our investments – they are genetically designed for the opportunities in front of them.

Royal Poinciana Country Club, Naples.

Royal Poinciana Country Club, Naples.

Though we had not met Pat before he was very familiar to us as the CI Global Equities Fund is a long-term shareholder of another firm he founded, Aon Corporation. Pat is a one of the great American success stories.

Pat was born and raised in Milwaukee where his father owned a Ford dealership. When Pat graduated from University one of his early pursuits as a young insurance agent was to offer insurance directly to auto dealership customers. At 26 he formed his own firm focusing on this endeavour and within seven years Pat had taken the company public.

Pat was observing that risks were becoming larger and more complex (driven by things like climate change, cyber security and novel health risks). So shortly after retiring from Aon, Pat decided to form RSG, a wholesale insurance broker with specialty expertise. RSG sits between a retail broker (like Aon) and the insurance carrier to facilitate the coverage of hard to insure risks that cannot be covered by standard insurance contracts.

Tim Turner is President of RSG having been with Pat since its inception. He started his career as a SWAT Officer (so we were a little nervous shaking his hand!). But Tim is a warm person who exudes energy and passion – particularly for talent and team development. Through a mutual friend Tim and Pat met over a beer in 2010 where Pat laid out his plans for RSG. At the time Tim was the CEO/ President of another wholesale broker, CRC. But following that conversation he decided to join Pat and the partnership was forged.

Today RSG is generating close to US$2B in revenues as the second largest wholesale broker in the United States and Tim’s stake in the company is worth $500m. He describes his first meeting with Pat as the “luckiest beer I ever drank”.

Niche Services Companies

“Niches get Riches” is commonly used to describe the attractive economics of niche industrial companies. These companies provide mission critical products that constitute a small component of their customer’s costs, making these customers quality, not price focused and very loyal.

We have observed a similar phenomenon in niche services companies. These businesses provide highly specialised, mission critical services that are beyond the core competency of the customer and often have the opportunity to roll up a fragmented industry. We have observed that proprietorial management teams are central to the success of niche services winners.

Insurance Brokerage is a great opportunity for a niche services dominator, like RSG. This is due to:

  1. Stable Demand
    With high recurring revenue – business insurance is unavoidable
  2. Need for specialised advice
    Business insurance is complex and tailored
  3. Favourable economics
    Highly cash flow generative and capital light (brokers don’t take underwriting risk on balance sheet)
  4. Fragmented Industry
    With scale economics emerging for the dominant player – insurance is becoming ever more complex, this means only large brokers able to provide specialised advice.

RSG entered the public markets in July 2021 amidst a record year for IPOs (with over 2,000 in the US alone). With such an exuberant backdrop we were not identifying much value latency in this part of the market – but the exception was RSG. We were deeply familiar with the people and the industry and could derisk the investment. We could see how Pat and his team executing against their strategy would create a pathway for us to meet our return objectives.

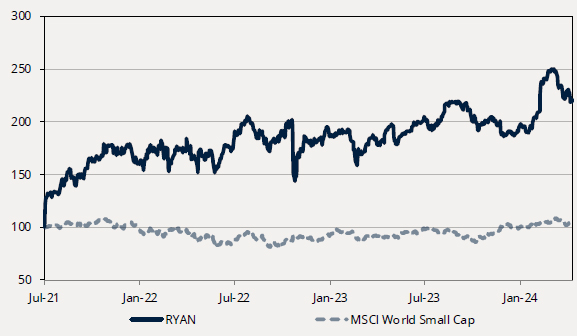
The below graph shows the performance of our investment in RSG relative to the Small Company Index across our investment period. So far, so good. We continue to hold Ryan as a core position in the Fund as a Compounder.

Performance: CI Endeavour Ryan Speciality Group (RSG)¹

Business Lessons

Our conversation with Pat and Tim became a masterclass in creating a high-performance niche services company. Three themes emerged during this conversation and these will form the core of what we will look for when we assess other potential niche services opportunities.

  1.  Independence
    The key is to create a customer-centric culture and always be seeking to create more value. Being part of a broader group can force competing priorities but independent firms can focus solely on optimising for the customer;
  2. Talent
    These are talent businesses. RSG has developed a talent development machine which is both highly intentional but also highly flexible. The flexibility point is crucial – it gives the freedom for talent to find their path, which includes moving talented people into another team when they’re not thriving.
  3. Specialisation
    RSG uses its scale to create specialist verticals (like cyber insurance). This allows RSG to add more value than generalist competitors, and ultimately deepen their relationships and maintain their fee structures.

We look forward to sharing insights like this one with our investors and hope to also organise events where you can speak directly with people like Pat and Tim.

¹ Past performance is not a reliable indicator of future performance.

Royalties as Real Assets

Purchasing Power of the Diminishing Dollar

Source: The Washington Post

Geoff Di Felice & Marcus Guzzardi

One of our favourite graphics on the perils of inflation is from a 1978 copy of the Washington Post, illustrating the purchasing power of $1.00 in 1958 had in 20 short years been inflated away to just $0.44. If you extend this exercise to 2023, what would that 1958 dollar be worth… just $0.12¹!

This brings us to the core focus of the Real Asset capital pool – we are seeking to maintain the real value of our capital over the long-term whilst also earning an attractive return. Given the significant and growing public sector debt, the potential risks to inflation will remain high for the decade ahead; from a debtor’s perspective the above arithmetic means if you borrowed one dollar in 1958, you only had to pay back $0.12 in 2023.

So what is a Real Asset and what gives them their real asset features?

We classify Real Assets as investments with highly predictable demand and inflation-linked revenues but not costs, such that the cash flows (and hence the asset value) maintain their real value. One question we like to pose to test an asset is, if the currency was to change from dollars to sheep, would it be so fundamental that it would still get paid the equivalent amount? This means these assets can transcend the financial system (as long as you hold onto your property rights…).

The concept of Real Asset investing has grown significantly over the past decade and as Wall Street and asset gathers have moved in, it has become a marketing term as much as an investing term. It’s crucial to focus on the essential characteristics of Real Assets, as “like” a Real Asset will not deliver the outcomes investors are seeking. We believe Real Assets must have all the following characteristics:

  1. Inflation-linked revenues and inelastic demand: revenue that is inflation-linked (contract, regulation, economics) with inelastic demand so the price increase is not offset by a volume decline.
  2. High margins and high fixed cost base: Inflation-linked revenues are not enough; the asset must not have a cost base that mirrors this. For example, many agriculture investments have very strong inflation protection in their revenues (driven by the commodity price) but typically this is more than offset by their cost base, which includes feed, energy and labour. Additionally, high margins allows for greater protection of free cash flow to small changes in costs.
  3. Long duration physical asset: this means once constructed the asset does not have to be rebuilt for many decades. As inflation increases, so too does the cost of constructing (replicating) the asset. So this will put pressure on new entrants (or keep them out), pushing up the market price or allowing the asset to increase its price.
  4. Focused Management Behaviour: ultimately we are investing in a corporate structure that owns the Real Asset. The structure and leadership can enhance or destroy all Real Asset benefits, for example through high-risk capital allocation and/or highly leveraged capital structures.

Historically attractive real assets have been real estate and infrastructure. They typically have inflation-linkages in their contracts or regulation, they have very high margins (typically 80%+) with a high fixed cost base and are long life assets. When we established the Endeavour Fund we observed these assets had come to be highly financialised – highly sophisticated investors, broad financial products/securities, returns that were bid down and typically employ very high levels of leverage – meaning the Real Asset characteristics had probably been diluted.

We have instead focused our Real Asset capital pool on Royalties. We have been investing in Royalties for many years over which time we have codified our approach to the asset class. We view Royalties as a highly specialised investment area due to the complex and heterogenous nature of the assets – which provides the opportunity for highly attractive returns. In particular, the greatest returns from Royalties are earned from their long-term optionality which the majority of the market lacks the patience to realise.

Overview of Royalties

Royalty assets derive their value from an underlying asset, of which they take a share of the revenue. For instance, if you owned the copyright of “Like a Rolling Stone” every time that song is played or performed you would receive a payment. Royalties have extremely attractive financial characteristics as they receive a top-line share of the underlying assets revenue but incur no operating or capital expenses to generate it. In the above example, Spotify is spending all the money to grow subscribers and the artist and record label are incurring all the expenses to record and promote the song. This can lead to some royalties having margins as high as 95%.

Royalties have been applied to a wide range of asset classes, including music and content, pharmaceutical and technology patents, precious metals (like Gold) and mining & minerals (like oil and gas). It is important to note, that while all royalties have some things in common, they are highly heterogeneous, this is driven by:

  • Structure of Royalty Agreement: royalties are not a standardised securities like common equities, the terms of the royalties could be regulated, legislated, or negotiated. The duration could be extremely long (in some cases perpetual) or quite short (less than a decade);
  • Underlying Asset Type: the asset type will determine many of the investment features, for instance if you own a perpetual royalty on a quality ore base there is some chance over the next 20 years an additional discovery could be found potentially increasing the value of your royalty multiple times but if you own a mature pharmaceutical royalty with three years remaining, it will provide more predictable payments and then terminate.
  • Underlying Asset Quality: the underlying asset quality is of maximum importance, in particular for long term optionality and capital preservation. Eg. a classic rock music catalogue has the potential to be used in commercials, TV/Film, documentaries and find whole new generations of audience. Whereas an obscure pop hit may have less optionality.

These differences make royalties highly specialised and prospective returns amongst royalty investments widely dispersed.

Mineral Royalties

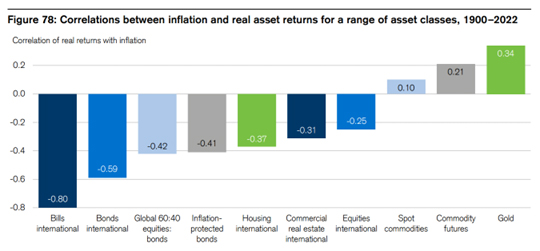
Correlations between inflation and real asset returns for a range of asset classes 1900-2022

Source: Credit Suisse Global Investment Returns Yearbook 2023

We have codified and invested across all the above-mentioned royalty sub-sectors. We have concluded that mineral royalties provide very attractive Real Asset features: uncorrelated cash flows, and an inflation hedge with long-term optionality not found in other royalty categories.

As this chart from Credit Suisse illustrates, commodities provide a hedge against inflation. The cost of extracting the underlying commodity tends to rise over time, such that over the past 20 years, a broad basket of commodities has increased at a rate greater than inflation. The miner incurs this cost through higher costs but the royalty owner does not, receiving the full benefit from the higher prices. However, the market does not tend to price this, assuming long term prices are relatively static. This makes sense for miners (as the inflation will typically be offset by their costs) but it underappreciates this is a benefit to royalty owners.

Value Latency

We seek to invest in Mineral Royalties when they trade at a 6-8% free cash flow yield (on long-term commodity price assumptions) but with embedded latencies that could deliver materially higher than this. The sources of value latencies are resource life extensions, volume expansions, new discoveries and capital allocation.

Focused Management Behaviour

We codified the behavioural attributes of exceptional royalty leaders, observing they have a rare mix of:

  • Deep technical skills: they understand the most attractive resource opportunities, where the hidden and emergent value lies.
  • Intuitive understanding of value creation: a deep, intuitive understanding of the option value that drives royalty value.
  • First principles thinker: spend most of their time alone studying, charting their course for which they are laser focused.
  • Patient, counter cyclical investors: able to behave counter-cyclically being patient for long periods and then moving aggressively when opportunity presents. We would suggest, it’s hard to be this without the first three.

By contrast, most of the industry is filled with financiers, their starting point is relying on external consultants for technical expertise. They have built portfolios filled with lower quality, short term assets that lack optionality and have limited capital allocation potential.

Capital Preservation

As we have stated capital preservation is a key precept of the Endeavour Fund. So you might ask, how does this apply to an investment driven by highly volatile commodity price? We have concluded a small number of royalty companies have excellent capital preservation characteristics and paradoxically the underlying volatility in their share price supports, rather than detracts from this. This is due to Royalty assets continuing to produce healthy free cash flow even during commodity price down cycles which provides the opportunity for management to deploy this capital into investments that are highly correlated to the commodity price (e.g., their own stock or additional royalty assets).

As returns are driven by asset quality and management talent, there is a very limited number of opportunities. This means we foresee long-term returns following a power law – the best opportunities will accrue significantly higher returns, supporting our approach of heavy due-diligence and concentrated investing.

We would encourage you to think of our Royalty holdings as a very long-term holding. We are unlikely to sell shares (outside valuation extremes) but will add to the positions when the market provides the opportunity. When the relevant commodity price is high the dividends and stock price will likely follow. But there will also be periods when they are low and we are reporting their share prices have fallen materially. When we do, think of what the management teams are doing in the background to increase the value of our investment.


¹ https://www.usinflationcalculator.com/.